Business Intelligence Dashboards and Reporting
We build business intelligence dashboards on a single source of truth: ERP, CRM, e-commerce and spreadsheet data combined in one reporting database, with KPIs and scheduled reports in Power BI, Looker Studio, Metabase or a custom app.
Related product
What's included
KPI and Report Design
We agree with management how each KPI is calculated and map out the screens and reports each role will see.
Data Integration (ETL)
We pull ERP, CRM, e-commerce, Google Sheets and Excel data on a schedule, clean it, match product and customer codes and combine it into one structure.
Reporting Database and Data Model
A separate data warehouse on PostgreSQL or BigQuery, modelled for reporting so it doesn't load your live systems, with every KPI defined in one place.
Power BI, Looker Studio and Metabase
Dashboards, filters, scheduled data refresh and sharing permissions that decide who sees what, in the tool your team already uses or prefers.
Custom Management Dashboards
Where off-the-shelf tools fall short, dashboards and target tracking screens built with Next.js that run on their own or inside your app.
Scheduled Reports and AI
Scheduled email reports, alerts when a KPI crosses a threshold you set, and an AI assistant that answers plain-language questions about your data.
Questions
What is business intelligence?
Business intelligence is the set of methods and tools that bring data from a company's different systems together and turn it into KPIs, reports and dashboards. The aim is to see both what happened last month and where you stand today with the same reliable numbers.
Power BI or a custom dashboard?
If your team works with Microsoft tools and wants to edit reports itself, Power BI is a good start; Looker Studio suits teams on Google tools, and Metabase is an open-source option you can run on your own server. If you plan to open dashboards to customers or dealers, per-user licences can add up quickly; in that case, or if you want dashboards inside your own app, custom development is often the better fit.
Which data sources can you combine?
ERPs such as Logo, Mikro, Netsis and SAP, your CRM and e-commerce platform, ad and analytics accounts, Google Sheets and Excel files. Any source that offers an API, database access or file exports can be connected.
How long does a BI project take and what does it cost?
It depends on the number of sources and how clean the data is. We usually suggest starting with the few dashboards you need most and growing from there; after a discovery call you get a clear timeline and a transparent quote, and you can outline your needs in our project planner.
Will reporting slow down our live systems, and is our data safe?
Reports read from a separate reporting database rather than your live ERP, and we load data outside busy hours or pick up only changed records, so daily operations are not slowed down. Access is limited by role, and with KVKK, Turkey's data protection law, in mind we move only the personal data reporting needs and mask it where necessary.
Can I ask questions of my data in plain language?
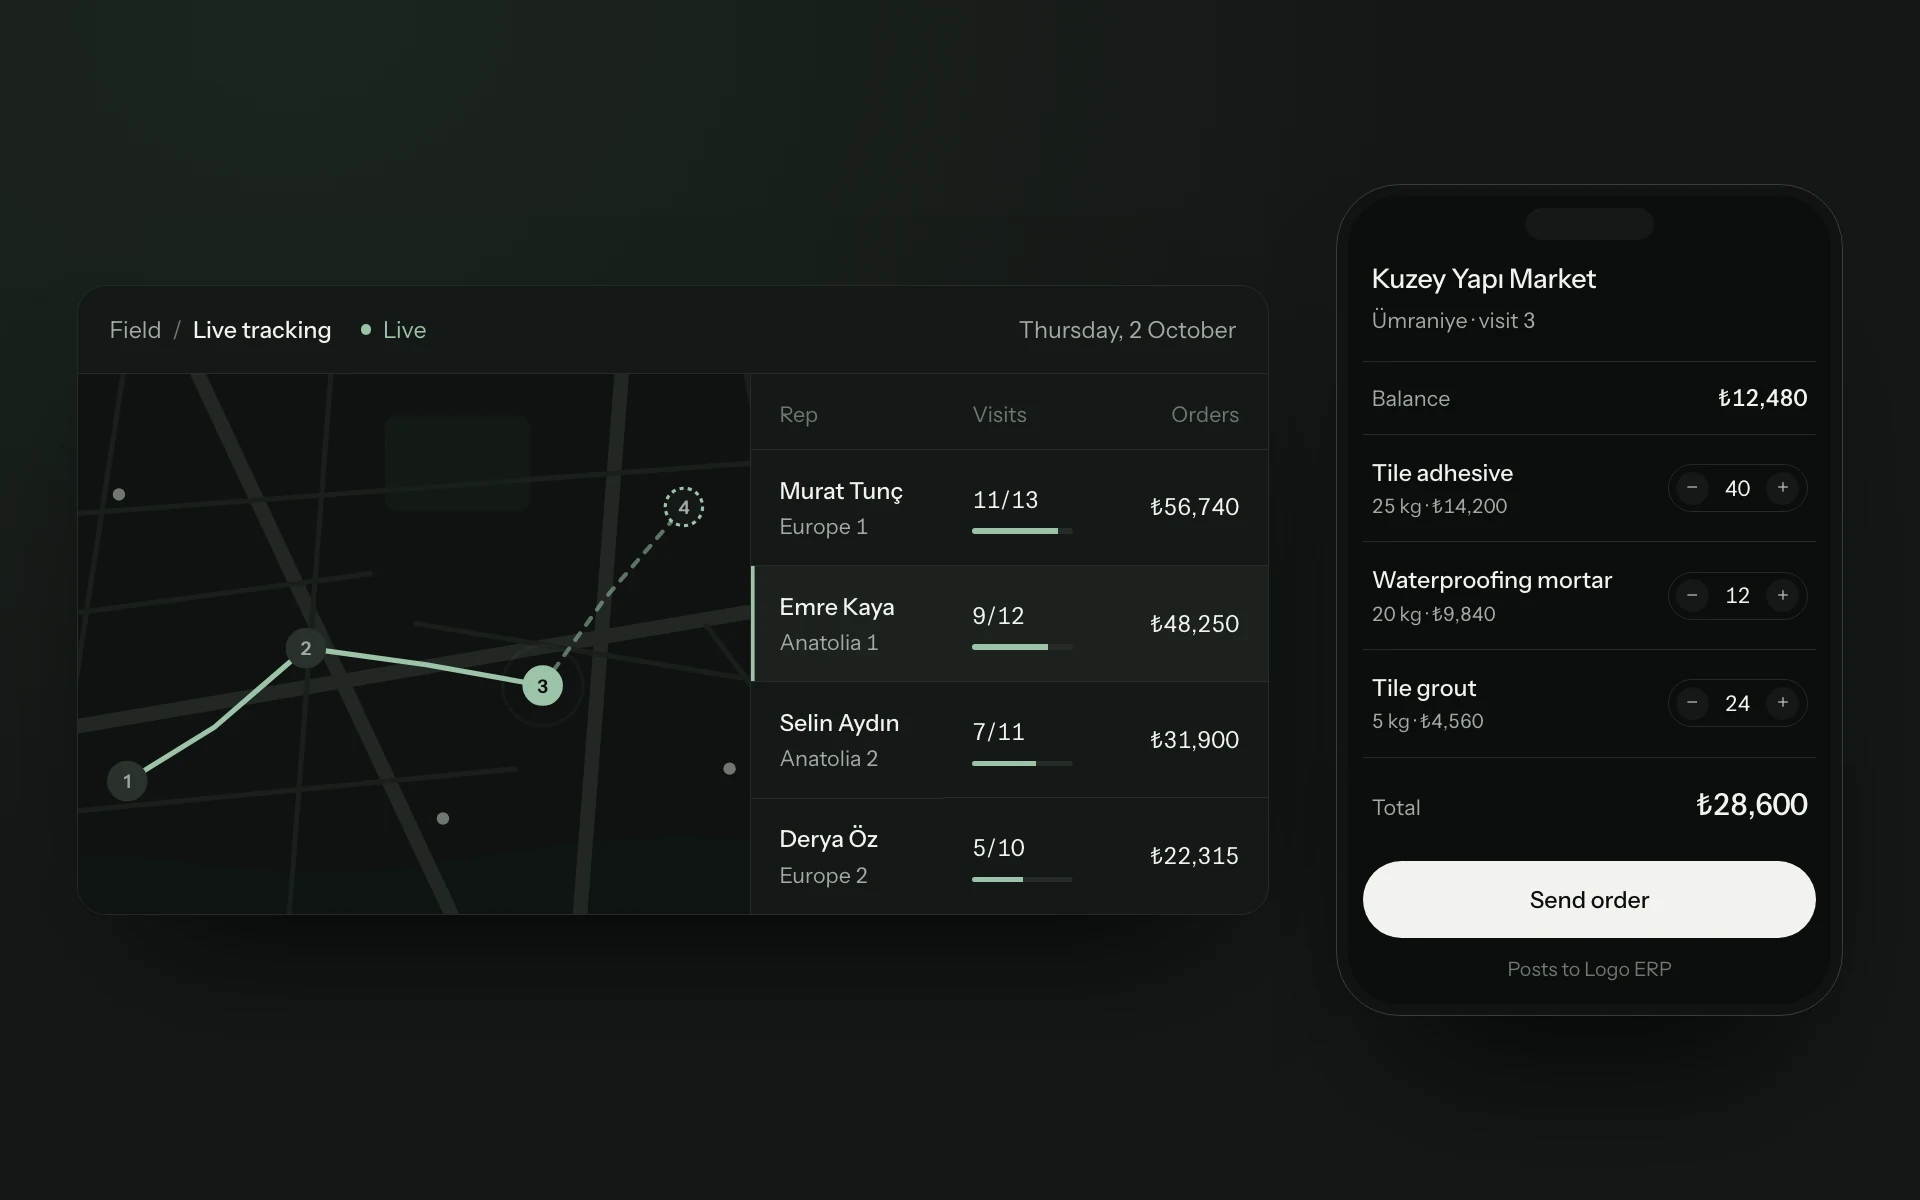
Yes. An AI assistant with read-only access to your reporting database turns a question such as which products sold best last month into a query and shows the result as a table or chart. In our own product, BernSFA, managers already follow live KPIs and target reports and query reports in plain language.
Related guides
All articlesHow to Integrate SAP: A Guide to Business One and S/4HANA
How to integrate SAP Business One and S/4HANA with ecommerce, B2B portals, field sales and CRM through Service Layer, OData, BAPI/RFC or IDoc, step by step.
E-Invoicing in Turkey: How to Integrate e-Fatura and e-Arşiv
E-invoicing in Turkey explained: e-Fatura vs e-Arşiv vs e-İrsaliye, private integrators, UBL-TR, taxpayer lookup and connecting your store and ERP.
Off-the-Shelf or Custom ERP? A Practical Decision Guide
Off-the-shelf vs custom ERP: when Logo, Mikro, Netsis or SAP is enough, when custom ERP software pays off, plus the hybrid model, total cost and a checklist.
ChatGPT API Integration for Business: A Practical LLM Guide
How to approach ChatGPT API integration for business: architecture, choosing between OpenAI, Claude and Gemini, cost drivers and security best practices.